Those Guys Real Estate News, Market Trends & More

You’ll find our blog to be a wealth of information, covering everything from local market statistics and home values to community happenings. That’s because we care about our community and want to help you find your place in it. Please reach out if you have any questions at all. We’d love to talk with you!

Oct. 8, 2024

Coronado Ranch Market Trends - September 2024

Coronado Ranch Market Report


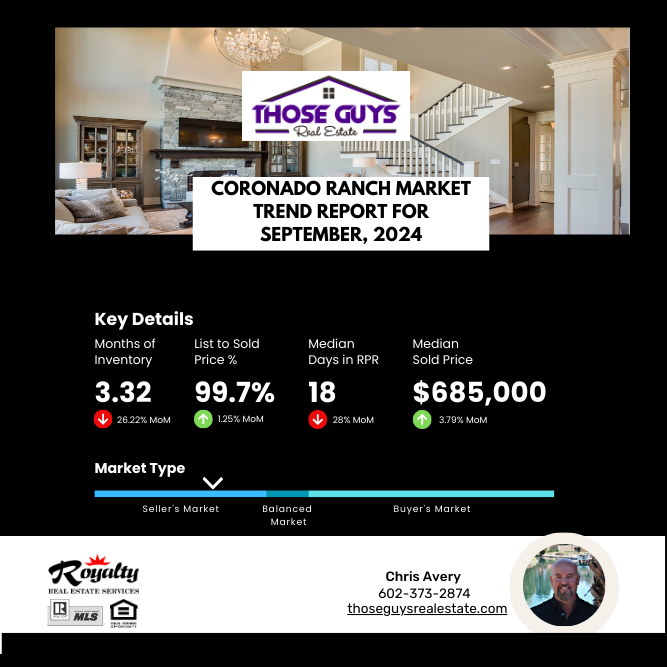
The Coronado Ranch Real Estate Market Report for September 2024

Hello Coronado Ranch! October is upon us and the cool mornings are giving us a little taste of the beautiful months ahead. Our community is waving goodbye to summer and hello to fall. Speaking of falling, that's exactly what happened in our market, but the indicators that fell were not the prices.

Months of Supply of Inventory

This was the first statistic to fall!  Months Supply of Inventory, which is currently sitting at 3.32 months. This means that if no new homes were to come on the market, it would take about 3.32 months to sell all the existing homes.

The inventory fell sharply by 26.22% this month. This is a good thing for those looking to sell, as there are few choices for new buyers' looking to make the move. 

Median Days on Market

Median Days Homes are On the Market was the next statistic to fall. September saw homes flying off the market in 18 days! 28% faster than the previous month. This reminds us that homes are selling quickly in this market.  Demand remains high and a solid pricing strategy are both key to selling your home quicky. 

List to Sold Price Percentage

The List to Sold Price Percentage climbed to 99.7% (up 1.25% from August) indicating that homes are selling very close to their listing prices. Buyer's still want to live in our great community and as long as Seller's continue to be competitive with their asking prices, this metric will remain strong.

Median Sold Price

Lastly, we have the Median Sold Price, which stands at $685,000. This gives us a snapshot of the price of homes that are selling in this market. This number has seen a modest increase of 3.79% over the last month. Home prices in Coronado Ranch continued their upward trajectory through the summer and the expectation is that a continued pedestrian increase will continue.

Coronado Ranch Real Estate Market Summary

So, what does all of this mean to you?

Overall, these metrics suggest that it's a good time to be a seller in Coronado Ranch. With low inventory, quick sales, and homes selling close to their asking prices, you could potentially have a successful selling experience. So if you're thinking about putting your home on the market, now might be a great time to do so!

Do you own a home in Coronado Ranch? Get our FREE monthly home valuation estimate, including the market activity report! This one report has everything you will need to stay on top of your home value, properties for sale in our neighborhood, & so much more.

Want to join the cool people and call Coronado Ranch home? Get instant updates on all Coronado Ranch Homes for Sale directly to your inbox so you never miss the opportunity to make the right move.

Posted in Coronado Ranch
Sept. 8, 2024

Coronado Ranch Market Trends - August, 2024

Coronado Ranch Real Estate Market Update for August, 2024

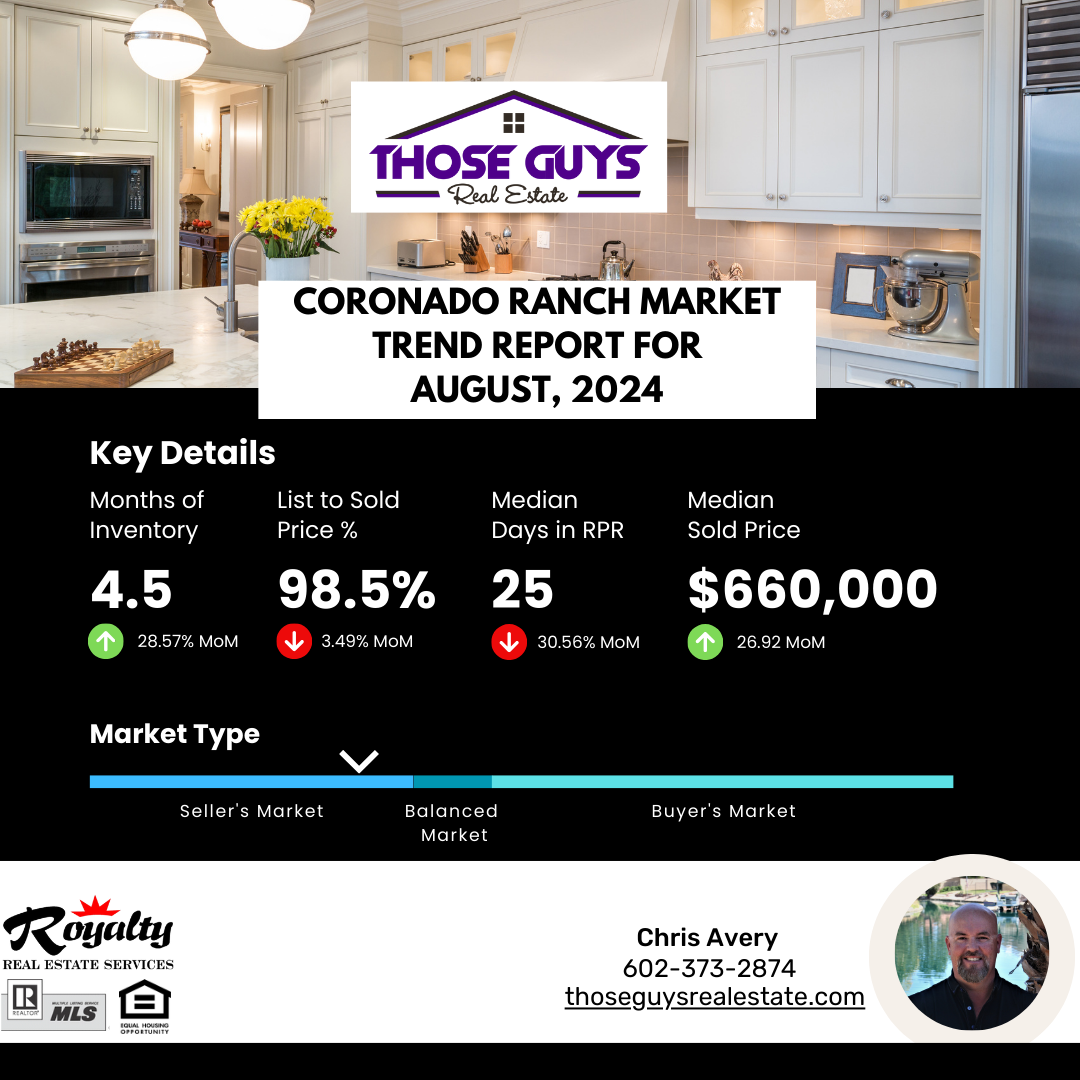
The Coronado Ranch Real Estate Market Report for August 2024

Hey there! It's Chris again with some information to help my current neighbors and future homeowners in our beautiful Coronado Ranch community. I'm not a number nerd by any means, but we will dive in together to see what the numbers are, what they really mean, and why they matter to us.

Months of Supply of Inventory

First up, we have the Months Supply of Inventory, which is currently sitting at 4.5. This number tells us how long it would take for all the current homes on the market to be sold at the current pace of sales. 

Next, we have the 12-Month Change in Months of Inventory, which has seen a significant increase of +134.38%. This sharp rise indicates that there are more homes on the market compared to a year ago, potentially giving buyers additional options in our community.

Median Days on Market

Moving on to the Median Days Homes are On the Market, which is a speedy 25 days. This tells us that homes are selling quickly in this market, which could be attributed to both high demand and well-priced properties. 

List to Sold Price Percentage

The List to Sold Price Percentage is an impressive 98.5%, indicating that homes are selling very close to their listing prices. This shows that sellers are pricing their homes competitively and buyers are jumping at the opportunity to call Coronado Ranch home.

Median Sold Price

Lastly, we have the Median Sold Price, which stands at $660,000. This gives us a snapshot of the average price of homes that are selling in this market. This number has seen a sharp increase of 26.92% of the last month. While this number hasn't quite reached the peaks it enjoyed in April & May of 2023, it is the third strongest month for prices in the last 5 years. Good news for our property values!

Coronado Ranch Real Estate Market Summary

So, what does all of this mean for you as a Buyer or Seller?

Well, with a relatively low Months Supply of Inventory and homes selling quickly, it could be a competitive market for buyers.

Sellers, on the other hand, may be able to command close to their asking price, given the high List to Sold Price Percentage.

Overall, these metrics paint us a picture that shows Coronado Ranch continues to be a highly desired community. The market continues to favor sellers, and home values continue their rise even if it's a bit slower than we saw over the last several years.

Do you own a home in Coronado Ranch? Get our FREE monthly home valuation estimate, including the market activity report! This one report has everything you will need to stay on top of home values, properties for sale & more. 

Want to join the cool people and call Coronado Ranch home? Get instant updates on all Coronado Ranch Homes for Sale directly to your inbox so you never miss the opportunity to make the right move.
 

Posted in Coronado Ranch
Sept. 8, 2024

Johnson Ranch August 2024

Johnson Ranch Market Report - August, 2024

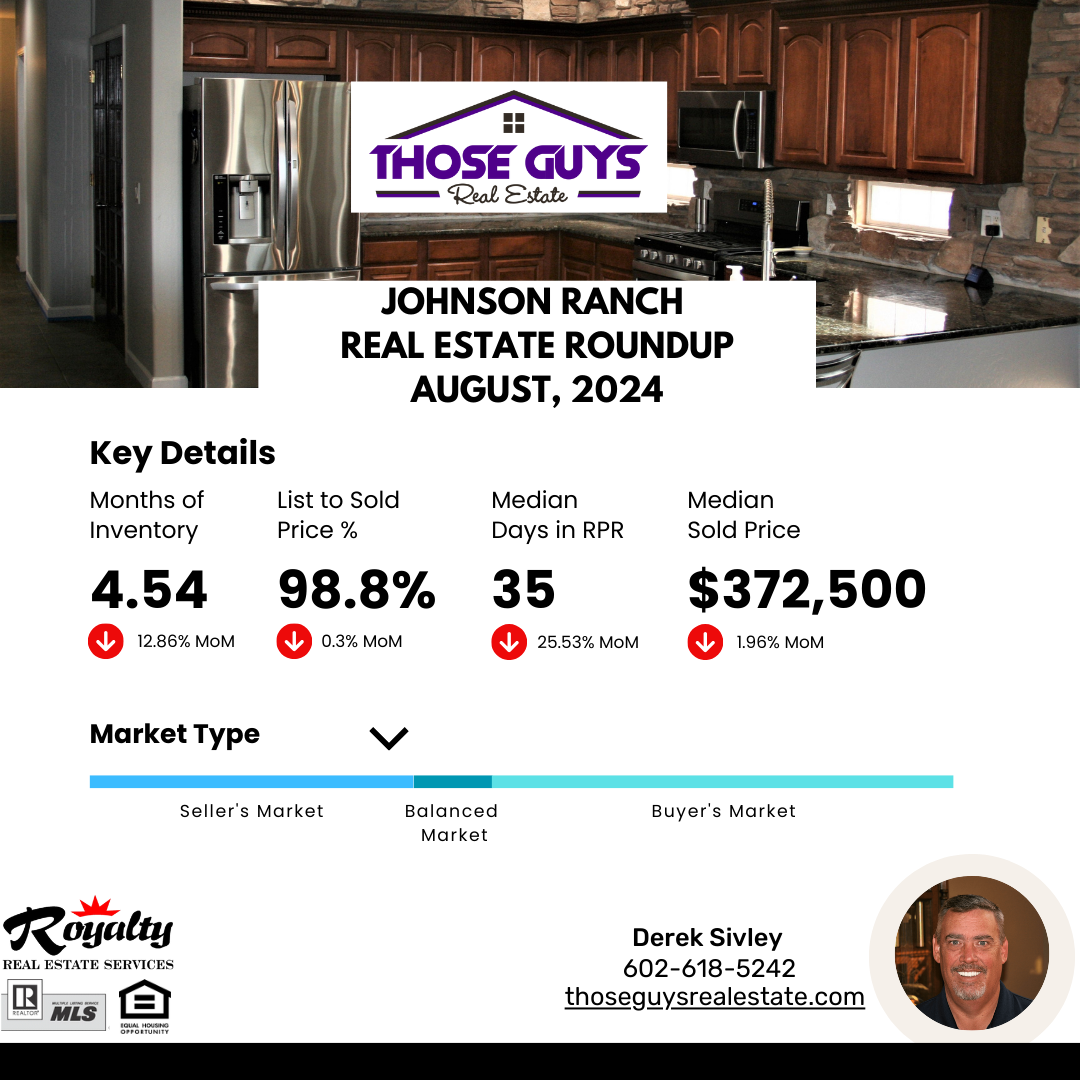
The Johnson Ranch Real Estate Market Report for August 2024

Months of Supply of Inventory

First, let's look at the Months Supply of Inventory, which is currently at 4.54. This means that at the current rate of sales, it would take 4.54 months to sell all the homes on the market. Typically, this number would indicate a balanced market as the number is between the 4-6 month mark; however, you will see the numbers below are keeping us slightly in the Seller's favor.

The 12-Month Change in Months of Inventory is at +134.02%. This sharp increase suggests that there has been a significant increase in the number of homes available for sale compared to the previous year.  This clearly favors home buyers in Johnson Ranch as the number of options available continues to remain very high. The significant retraction month over month (-115.98%) is a trend that could further limit buyer choices if the trend continues.

Median Days on Market

The Median Days Homes are On the Market is 35, which indicates that homes are selling relatively quickly in this market. This number shows there is a strong demand for homes in Johnson Ranch which favors sellers.

List to Sold Price Percentage

The List to Sold Price Percentage is at 98.8%, which means that on average, homes are selling for 98.8% of their list price. This percentage is a good indicator of the competitiveness of the market and whether sellers are able to get close to their asking price. This metric has remained nearly unchanged over the last month, and this bodes well for those looking to put their Johnson Ranch home for sale.

Median Sold Price

Lastly, the Median Sold Price is $372,500, which is the middle point of all the home prices sold in the market. While is metric has reduced slightly in the last month (-1.96%) it is worth keeping an eye on as well as the inventory numbers.

Johnson Ranch Real Estate Market Summary

Overall, the correlation between these metrics suggests that there is a healthy level of inventory in the market, homes are selling relatively quickly, and sellers are getting close to their asking price. Buyers and sellers should pay attention to these metrics to make informed decisions as the market continues to drift from a Seller's Market to a more Balanced Market.


Want to know more about Johnson Ranch? Check out the Johnson Ranch Community Page Here!

Do you live in Johnson Ranch? Stay in the know on the latest Real Estate happenings in Johnson Ranch by getting your free monthly Home Valuation and Market Activity Report. 

Posted in Johnson Ranch
Aug. 9, 2024

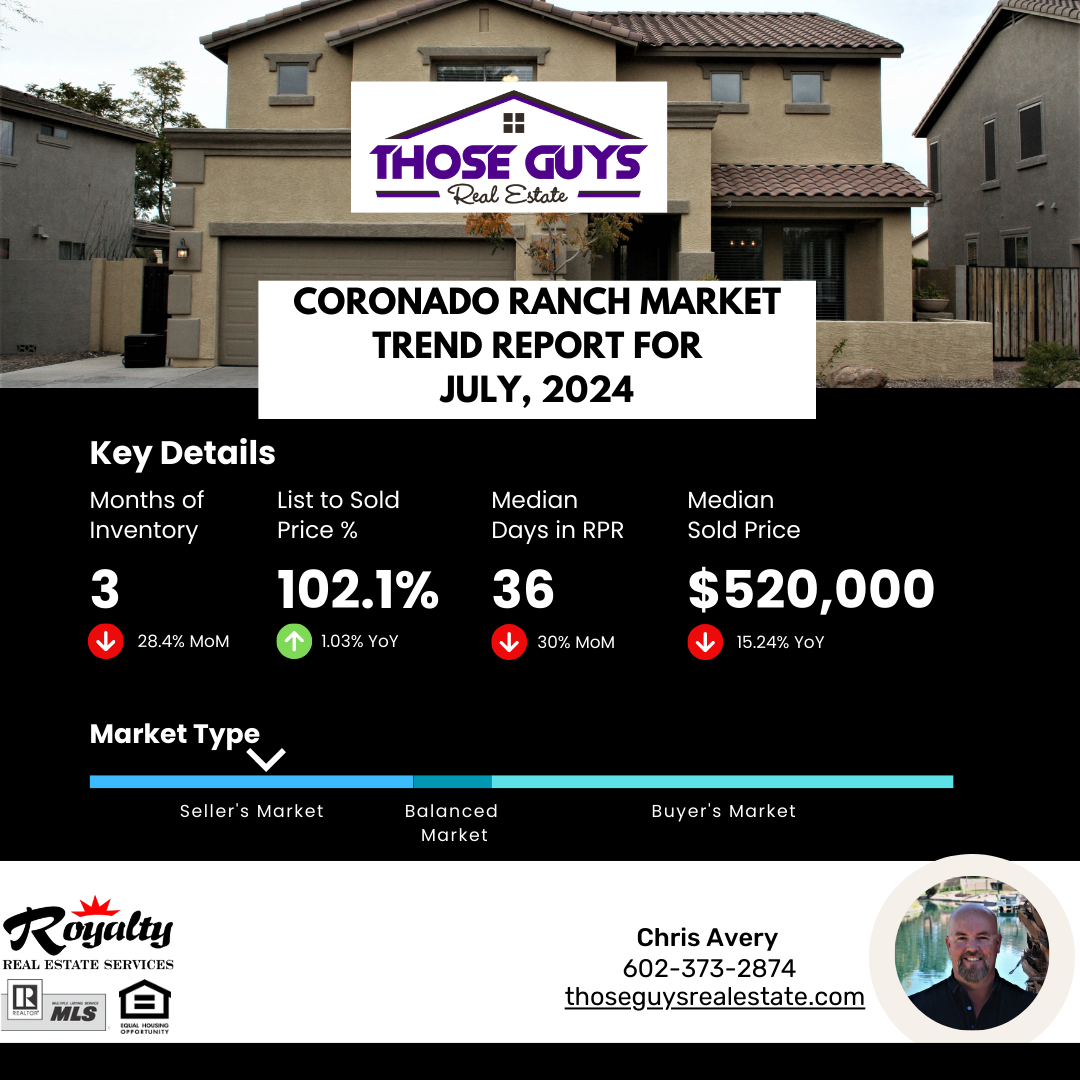
Coronado Ranch Market Trends - July, 2024

Coronado Ranch Market Trends - July, 2024

When looking at these real estate metrics, we can see a correlation between them that can be helpful for both buyers and sellers to understand the current market conditions.

First, let's look at the Months Supply of Inventory, which is 3. This metric tells us how long it would take for all the current homes on the market to sell at the current pace of sales. A lower number, like 3, indicates a seller's market where there is high demand and limited supply.

Next, the percentage of Change in Months of Inventory (-28.4%) gives us insight into whether the market is trending towards a buyer's or seller's market. As this number is decreasing, it means inventory is tightening, which could lead to higher prices and more competition for buyers.

The Median Days Homes are On the Market is 36, which shows us that homes are selling relatively quickly in this market. This could be due to the high demand and low inventory, leading to a faster turnover of properties.

The List to Sold Price Percentage being 102.1% indicates that homes are selling for slightly above their listing price on average. This could be a result of multiple offers and bidding wars in a competitive market or simply the desirability of the neighborhood in conjunction with limited 102.1% of homes for sale.

Lastly, the Median Sold Price of $520,000 gives us an idea of the overall price range in this market. Buyers can use this information to understand the typical price point they may encounter, while sellers can use it to price their home competitively.

Overall, these metrics paint a picture of a competitive and fast-moving real estate market with high demand and limited supply. Buyers may need to act quickly and be prepared to offer above asking price, while sellers may find themselves in a favorable position with the potential for a quick sale at a strong price. As the number of homes sold in any 12 month period is extremely low in Coronado Ranch, the data should be confirmed with a real estate professional with a complete understanding of the neighborhood market. 

Posted in Coronado Ranch
Aug. 9, 2024

Johnson Ranch - July, 2024

Johnson Ranch Market Trends - July 2024

As a real estate professional, it is important to understand the correlation between key metrics in the market to help buyers and sellers make informed decisions. 

First, let's look at the Months Supply of Inventory, which currently stands at 4.76. This figure indicates the number of months it would take to sell all the current inventory of homes on the market if no new listings were added. A lower number typically signifies a seller's market, while a higher number indicates a buyer's market. The trend below shows an increase of 6.49% from last month indicating it's taking a bit longer for home seller's to find that buyer.

The 12-Month Change in Months of Inventory has seen a significant increase of +250%. This suggests that the market has shifted towards a more balanced or even a buyer's market in the past year, as there are more homes available for sale compared to demand.

The Median Days Homes are On the Market is 49, indicating that homes are selling relatively quickly in this market. This factors that are putting upward pressure on this metric continue to be relatively high interest rates and increasing inventory providing buyers with more options during their home search.

The List to Sold Price Percentage is 99.1%, which shows that homes are generally selling very close to their list price. This is an indicator of a strong seller's market where buyers are willing to pay close to asking price for desirable properties.

Finally, the Median Sold Price in this market is $384,900. This figure represents the middle price point of all homes sold, indicating the general price range of properties in this market.

In conclusion, the current real estate market appears to be experiencing a shift towards a more balanced or buyer-friendly market, as indicated by the increase in months of inventory and the relatively high median days on the market. However, sellers can still expect to receive close to their asking price, as shown by the high list-to-sold price percentage. As with any market at or nearing a balanced state, some indicators will favor the seller and others will favor the buyer. Buyers and sellers should be aware of these trends and work with a knowledgeable real estate agent to navigate the market effectively.


Posted in Johnson Ranch
Aug. 14, 2023

August 2023

Posted in Market Updates
July 17, 2023

July 2023

Posted in Market Updates
June 19, 2023

June 2023

Posted in Market Updates
June 14, 2023

May 2023

Posted in Market Updates
June 14, 2023

April 2023

Posted in Market Updates